
未来又多了一个可以测试显卡的项目。
UL 推出的 Procyon Benchmark 在近期更新,这次更新主要是加入 AI Image Generation Benchmark。


新推出的UL Procyon AIMage Generation Benchmark是为了更好地衡量中阶、中高阶与高阶独立显示卡的效能而推出,它包含2个测试项目,分别是Stable Diffusion XL(FP16)与StableDiffusion 1.5(FP16)。
Stable Diffusion XL(FP16)与 Stable Diffusion 1.5(FP16)测试项目提供 3 中 AI Inference Engine 进行测试,这包含 TensorRT、Intel OpenVINO 与 ONNX Runtime。
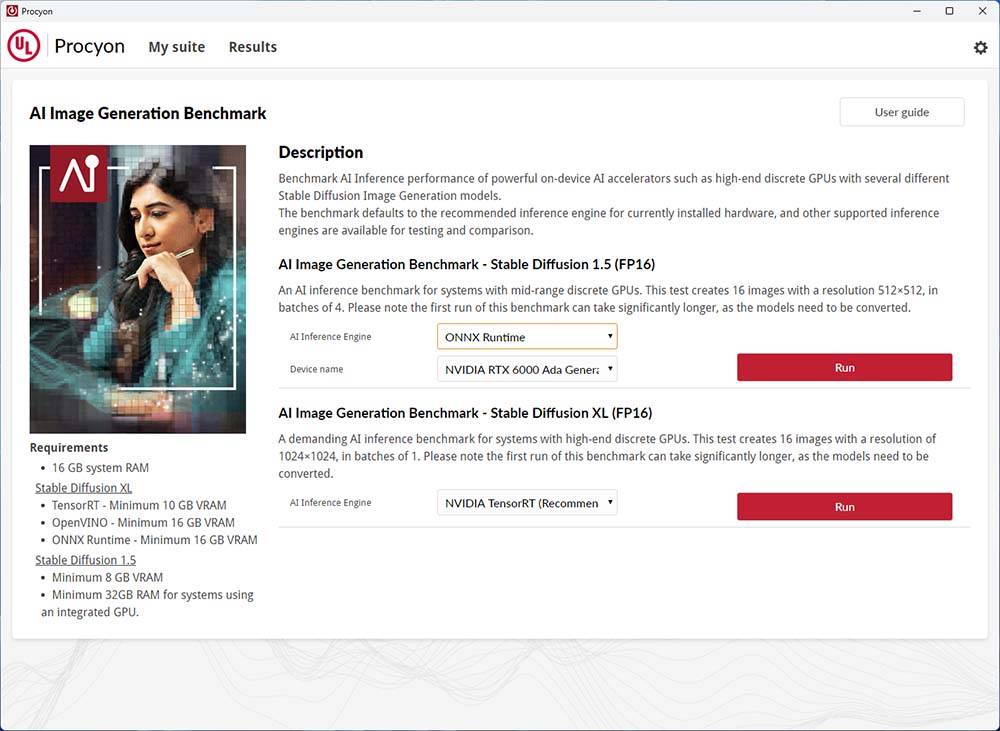
在 Stable Diffusion XL(FP16)中,TensorRT 最低需要 10GB VRAM,OpenVINO 需要 16GB VRAM,至于 ONNX Runtime 最低则是 16GB VRAM;至于针对中高阶显卡的 Stable Diffusion 1.5(FP16)最低则需要 8GB VRAM。
我们选择了以下显卡进行测试:
AMD
– Radeon RX 7900 XTX 24GB MBA
– Radeon RX 7900 XT 20GB MBA
– Sapphire Radeon RX 7900 GRE 20GB Nitro+
– Radeon RX 7800 XT 16GB MBA
– Radeon RX 7700 XT 12GB Pulse
Intel
– Intel Arc A770 16GB Limited Edition

NVIDIA
– GeForce RTX 4090 24GB Founders Edition
– GeForce RTX 4080 16GB Founders Edition
– TUF Gaming GeForce RTX 4070 Ti 16GB
– GeForce RTX 4070 12GB Founders Edition
测试部分先看看TensorRT这个AI Inference Engine的数据,这部分就只有NVIDIA GeForce显卡能够执行。
| Overall Time (sec) |
Image Generation Speeds (Image / sec) |
Score | |
|---|---|---|---|
| Stable Diffusion XL(FP16) | |||
| GeForce RTX 4090 | 126.417 | 7.901 | 4746 |
| GeForce RTX 4080 | 193.202 | 12.075 | 3105 |
| GeForce RTX 4070 Ti | 234.969 | 14.686 | 2553 |
| GeForce RTX 4070 | 346.408 | 21.651 | 1732 |
| Stable Diffusion 1.5(FP16) | |||
| GeForce RTX 4090 | 18.413 | 1.151 | 5430 |
| GeForce RTX 4080 | 28.457 | 1.779 | 3514 |
| GeForce RTX 4070 Ti | 37.859 | 2.365 | 2641 |
| GeForce RTX 4070 | 50.507 | 3.157 | 1979 |
跟着就是Intel OpenVINO部分,但因为 Stable Diffusion XL(FP16)最低要求为 16GB,因此我们没有将 8GB 的 Intel Arc A750 与 Intel Arc A580 加入测试。
| Overall Time (sec) |
Image Generation Speeds (Image / sec) |
Score | |
|---|---|---|---|
| Stable Diffusion XL(FP16) | |||
| Intel Arc A770 | 817.794 | 51.112 | 733 |
| Stable Diffusion 1.5(FP16) | |||
| Intel Arc A770 | 144.908 | 9.057 | 690 |
最后是ONNX Runtim AI Inference Engine的测试数据。
| Overall Time (sec) |
Image Generation Speeds (Image / sec) |
Score | |
|---|---|---|---|
| Stable Diffusion XL(FP16) | |||
| GeForce RTX 4090 | 172.309 | 10.769 | 3482 |
| GeForce RTX 4080 | 264.619 | 16.539 | 2267 |
| GeForce RTX 4070 Ti | 330.064 | 20.629 | 1817 |
| Radeon RX 7900 XTX | 382.361 | 23.898 | 1569 |
| GeForce RTX 4070 | 431.601 | 26.975 | 1390 |
| Radeon RX 7900 XT | 439.651 | 27.478 | 1364 |
| Radeon RX 7900 GRE | 479.453 | 29.966 | 1251 |
| Radeon RX 7800 XT | 628.809 | 39.301 | 954 |
| Radeon RX 7700 XT | 665.666 | 41.604 | 901 |
| Intel Arc A770 | 2755.363 | 172.21 | 217 |
| Stable Diffusion 1.5(FP16) | |||
| GeForce RTX 4090 | 27.35 | 1.709 | 3656 |
| GeForce RTX 4080 | 40.59 | 2.537 | 2463 |
| GeForce RTX 4070 Ti | 50.476 | 3.155 | 1981 |
| Radeon RX 7900 XTX | 51.715 | 3.232 | 1933 |
| Radeon RX 7900 XT | 59.913 | 3.745 | 1669 |
| GeForce RTX 4070 Ti | 65.879 | 4.117 | 1517 |
| Radeon RX 7900 GRE | 67.319 | 4.207 | 1485 |
| Radeon RX 7800 XT | 82.508 | 5.157 | 1211 |
| Radeon RX 7700 XT | 90.829 | 5.677 | 1100 |
| Intel Arc A770 | 351.159 | 21.947 | 284 |
Intel Arc 在 UL Procyon AI Benchmark 的表现实在不怎样,如果用「不入流」来形容它,应该不太好,但 Intel Arc A770 在测试所需要的时间最久,若想要使用 Intel Arc A770 执行 Stable Diffusion 可能要好好思考一下。
至于Intel会不会在未来的驱动程序强化,就让我们继续观望吧。
整体来说,Ada Lovelace GPU架构的 GeForce RTX 40 系列表现依旧优异,在 TensorRT AI Inference Engine 方面,更能轻易看到其优势。