
跟着来看看我们收到的第二张 GeForce RTX 4070 Super 显卡。
ASUS GeForce RTX 40 系列中,双风扇的 Dual 系列显卡让我们有着相当不错的体验,而这次的 GeForce RTX 4070 Super 系列显卡中,除了 Founders Edition 外,我们也收到了 ASUS Dual GeForce RTX 4070 Super。
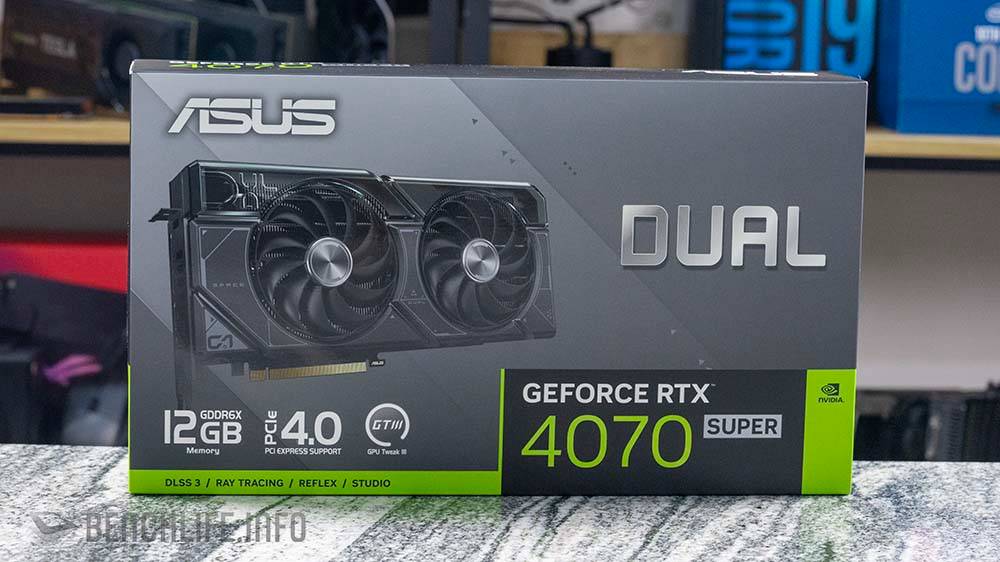

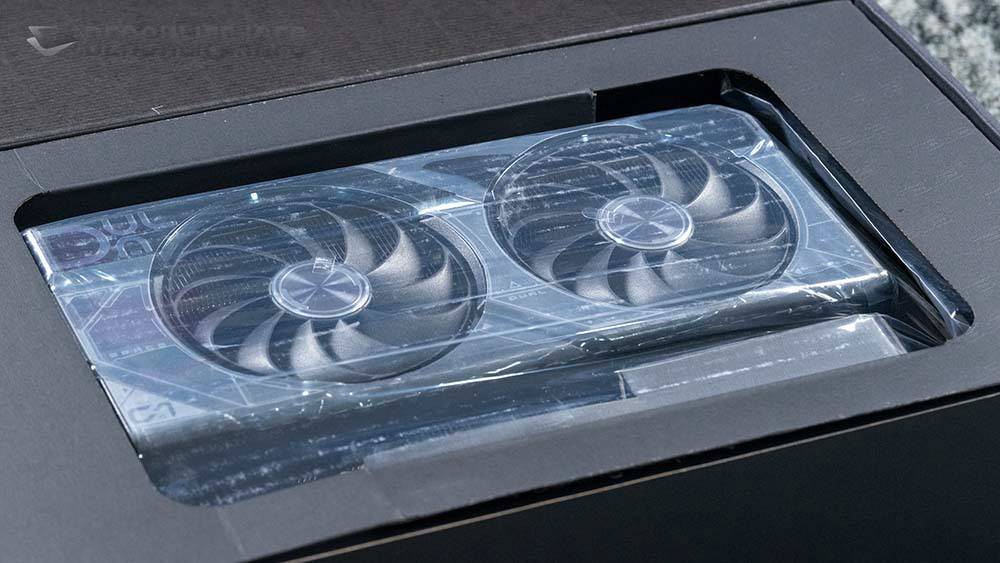
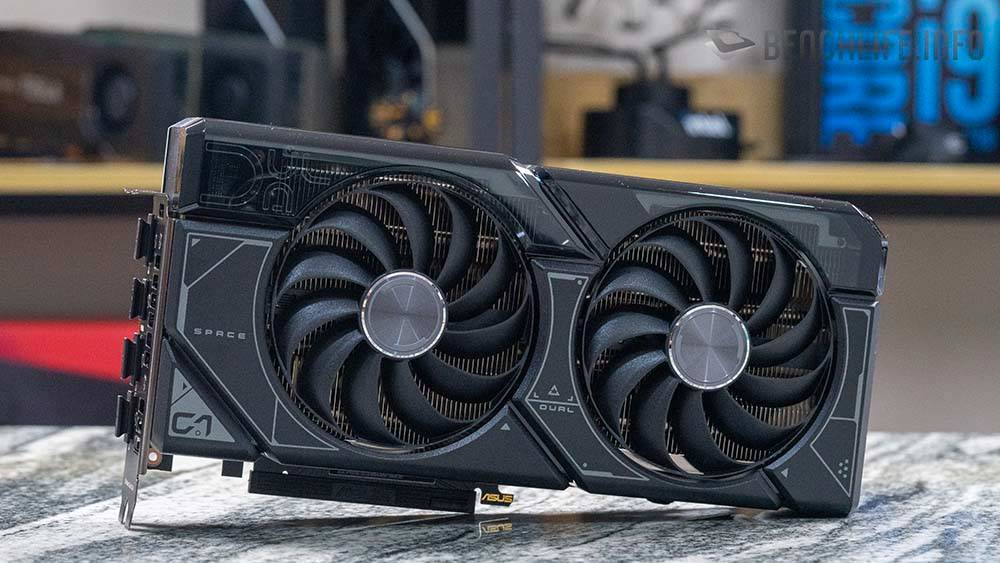
延续着 Dual GeForce RTX 4070 的优点,新登场的 Dual GeForce RTX 4070 Super 显示卡采用双风扇设计,并拥有 0dBA 风扇停转功能(50 度以下); 95mm 的轴向式风扇,搭配上 11 叶片以及双滚珠轴承(Double Ball Bearing),让 2.56 槽的 Dual GeForce RTX 4070 Super 有着非常优异的散热表现。
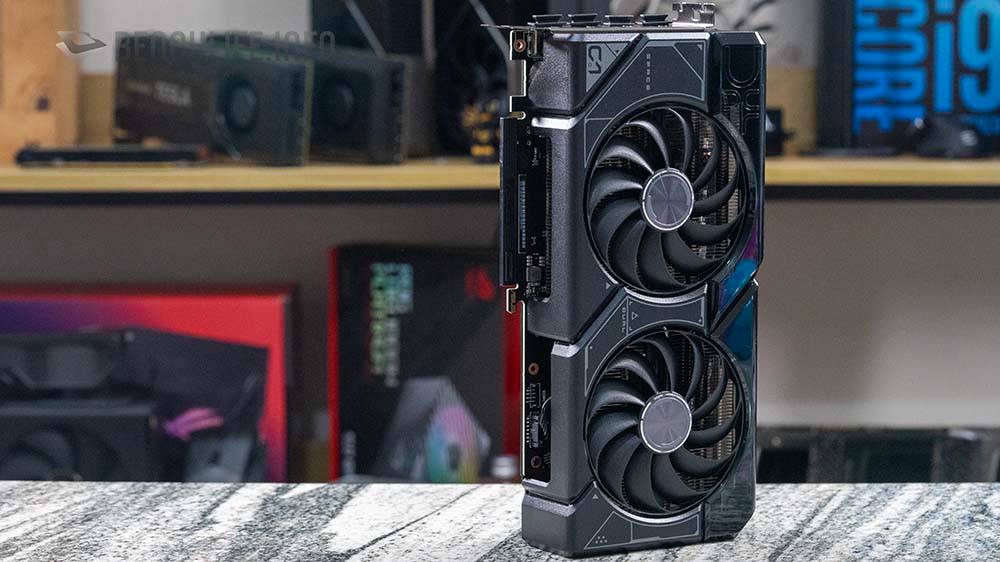

金属的强化背板,也是 Dual GeForce RTX 4070 Super 的一个特点。

ASUS官方给出双滚珠轴承风扇可以提供70,000小时的使用时间,相较于油封轴承的35,000小时高出一倍。
此外,Dual GeForce RTX 4070 Super散热器采用4根热导管设计,能够更有效率的将GPU与VRAM的热导出。
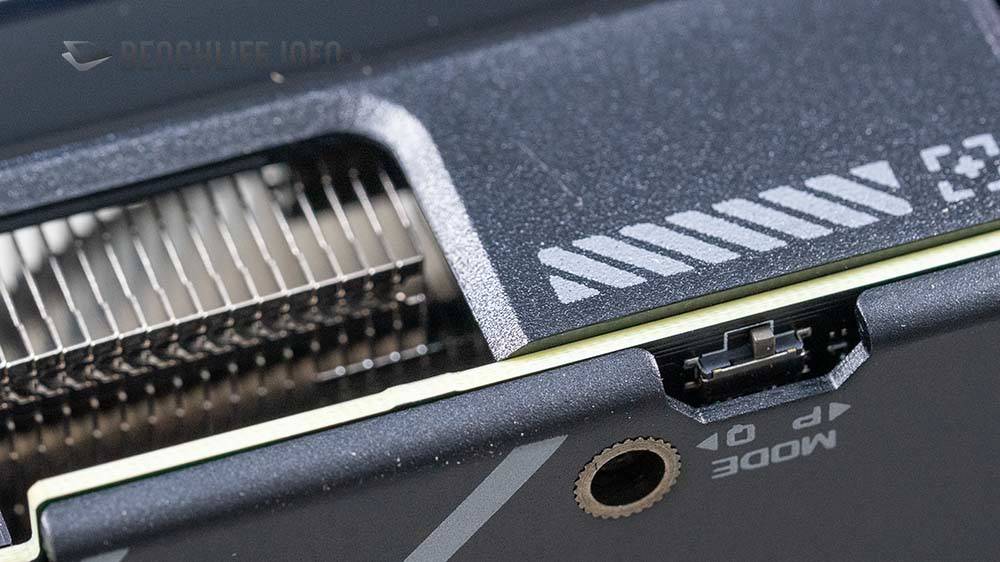
跟着就是此款显卡提供了 vBIOS 切换功能,让用户可以在 Performance 于 Quiet Mode 进行切换,但一般来说,会建议使用预设的 Performance Mode,因为差异在于风扇转速不同,且安装在机壳内,一般很难会听到到风扇转动的声音。
往往来说… 显示卡的高频音还比较常听到…
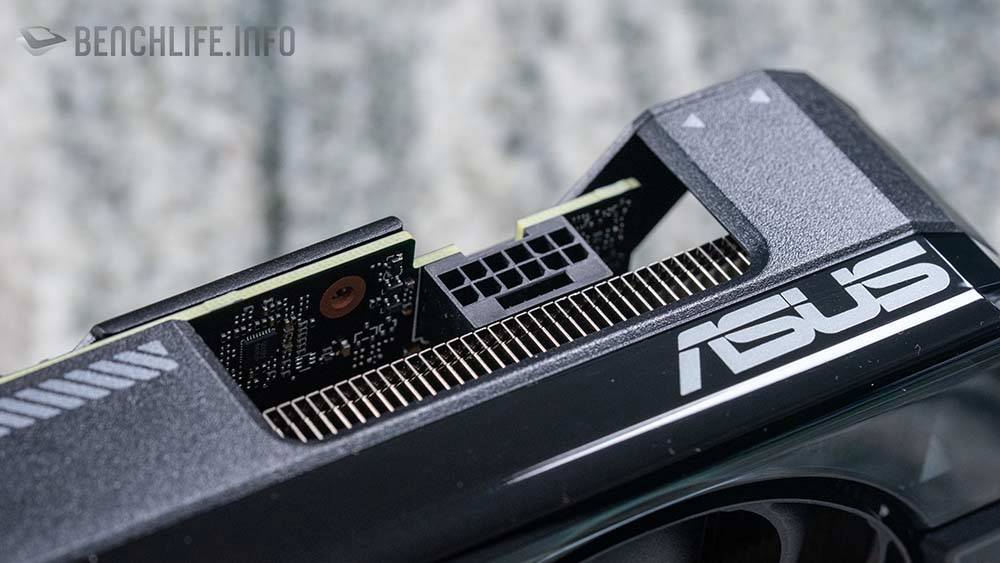
与 Founders Edition 相同,Dual GeForce RTX 4070 Super 采用 12VHPWR 接头,并且盒子内提供一组 2x 8 PIN to 12VHPWR 转接线。
最后一个特点,就是 304 不锈钢材质的 I/O Bracket,搭配上 1x HDMI 2.1a 与 3x DisplayPort 1.4a 输出端子。

ASUS Dual GeForce RTX 4070 Super 的预设模式的 Boost Clock 为 2475MHz,至于 OC 模式的 Boost Clock 则可以达到 2505MHz。
跟着就是来看看Dual GeForce RTX 4070 Super的性能实测,这里我们找了Radeon RX 7800 XT和GeForce RTX 3070这两张显卡与Dual GeForce RTX 4070 Super进行比较。
3DMark – GeForce RTX 3070 vs Dual GeForce RTX 4070 Super
| 3DMark | GeForce RTX 3070 | Dual GeForce RTX 4070 Super | |
|---|---|---|---|
| TIme Spy | 14513 | 21428 | 32.271% |
| Graphic score | 13576 | 21073 | 35.576% |
| CPU score | 23847 | 23690 | -0.663% |
| Time Spy Extreme | 7260 | 10513 | 30.943% |
| Graphic score | 6707 | 10104 | 33.620% |
| CPU score | 13627 | 13645 | 0.132% |
| Fire Strike | 30692 | 40852 | 24.870% |
| Graphic score | 34053 | 49436 | 31.117% |
| Physics score | 56458 | 56348 | -0.195% |
| Combo score | 12659 | 15048 | 15.876% |
| Fire Strike Extreme | 16759 | 24778 | 32.363% |
| Graphic score | 16683 | 24914 | 33.038% |
| Physics score | 56155 | 56388 | 0.413% |
| Combo score | 8305 | 13169 | 36.935% |
| Fire Strike Ultra | 8793 | 12697 | 30.747% |
| Graphic score | 8471 | 12183 | 30.469% |
| Physics score | 56539 | 56629 | 0.159% |
| Combo score | 4439 | 6874 | 35.423% |
| Speed Way | 3483 | 5259 | 33.771% |
| Port Royal | 8404 | 13117 | 35.930% |
| DXR feature test | 32.16 | 62.55 | 48.585% |
1440p Gaming – GeForce RTX 3070 vs Dual GeForce RTX 4070 Super
| GeForce RTX 3070 | Dual GeForce RTX 4070 Super | ||
|---|---|---|---|
| Assassin Creed Vahalla | 91 | 128 | 28.906% |
| Borderlands 3 : bad ass | 83.36 | 121.35 | 31.306% |
| Cyberpunk2077(Ultra) | 64.36 | 91.26 | 29.476% |
| Cyberpunk2077(OverDrive+DLSS2 P) | 49.03 | 75.52 | 35.077% |
| Cyberpunk2077(OverDrive+DLSS3) | – | 107.79 | – |
| Guardian of Galaxy (Ultra High+RT)) | 72 | 109 | 33.945% |
| Metro Exodus | 82.84 | 121.71 | 31.937% |
| F1 22 (Ultra High) | 62 | 95 | 34.737% |
| F1 22 (Ultra High+DLSS2 P) | 128 | 169 | 24.260% |
| F1 22 (Ultra High+DLSS3) | – | 225 | – |
| Forza Horizon 5(Max) | 84 | 123 | 31.707% |
| Horizon Zero Dawn | 119 | 164 | 27.439% |
| Rainbow Six Siege | 330 | 496 | 33.468% |
| Shadow of the Tomb Raider (highest) | 122 | 188 | 35.106% |
| Total War: Three Kingdom) | 72.4 | 109.7 | 34.002% |
| Watch Dog Legion(Ultra) | 79 | 111 | 28.829% |
| Watch Dog Legion(RT_Ultra DLSS_P) | 79 | 117 | 32.479% |
与GeForce RTX 3070进行比较的话,游戏部分至少也有24%的领先,但更多的是30%的领先幅度,与3DMark在DirectX 12和DirectX 11部分的测试相去不远; 因为 Ampere 架构的 GeForce RTX 30 系列不支持 DLSS 3,因此部分游戏无法获得数据。
Creative – GeForce RTX 3070 vs Dual GeForce RTX 4070 Super
| GeForce RTX 3070 | Dual GeForce RTX 4070 Super | ||
|---|---|---|---|
| Blender | |||
| Monster | 1551 | 3327 | 53.381% |
| Junk Store | 944 | 1562 | 39.565% |
| fishy_cat | 867 | 1671 | 48.115% |
| PugetBench – Premiere Pro | |||
| overall | 11729 | 14344 | 18.231% |
| LongGOP Score | 128 | 146 | 12.329% |
| Intraframe Score | 132 | 140 | 5.714% |
| Raw Score | 175 | 253 | 30.830% |
| GPU | 64 | 83 | 22.892% |
| Davinci Resolve | |||
| 50% retime | 134 | 20 | -570.000% |
| Wedding Heavy Styles | 53 | 38 | -39.474% |
| SuperScale 2x | 17 | 12 | -41.667% |
| SuperScale 4xHD | 88 | 66 | -33.333% |
| Speed Warp | 16 | 12 | -33.333% |
| magic mask | 26.57 | 18.65 | -42.466% |
| Stable diffusion | |||
| SD 1.5 (50 steps) | 18.75 | 35 | 46.429% |
| 512×512 images/minute | |||
| SDXL (20 steps) | 2.89 | 24.5 | 88.204% |
| 768×768 images/minute | – | 11.5 | – |
Davinci Resolve 部分的测试数据需要特别留意,因为这里是是数字越小,表现越佳。
3DMark – Radeon RX 7800 XT vs Dual GeForce RTX 4070 Super
| 3DMark | AMD Radeon RX 7800 XT | Dual GeForce RTX 4070 Super | |
|---|---|---|---|
| TIme Spy | 19343 | 21428 | 9.730% |
| Graphic score | 18863 | 21073 | 10.487% |
| CPU score | 22607 | 23690 | 4.572% |
| Time Spy Extreme | 9397 | 10513 | 10.615% |
| Graphic score | 8908 | 10104 | 11.837% |
| CPU score | 13649 | 13645 | -0.029% |
| Fire Strike | 38251 | 40852 | 6.367% |
| Graphic score | 47327 | 49436 | 4.266% |
| Physics score | 56222 | 56348 | 0.224% |
| Combo score | 13110 | 15048 | 12.879% |
| Fire Strike Extreme | 23713 | 24778 | 4.298% |
| Graphic score | 24112 | 24914 | 3.219% |
| Physics score | 55641 | 56388 | 1.325% |
| Combo score | 11949 | 13169 | 9.264% |
| Fire Strike Ultra | 12268 | 12697 | 3.379% |
| Graphic score | 11934 | 12183 | 2.044% |
| Physics score | 56198 | 56629 | 0.761% |
| Combo score | 6251 | 6874 | 9.063% |
| Speed Way | 3803 | 5259 | 27.686% |
| Port Royal | 10183 | 13117 | 22.368% |
| DXR feature test | 33.98 | 62.55 | 45.675% |
1440p Gaming – Radeon RX 7800 XT vs Dual GeForce RTX 4070 Super
| Radeon RX 7800 XT | Dual GeForce RTX 4070 Super | ||
|---|---|---|---|
| Assassin Creed Vahalla | 124 | 128 | 3.125% |
| Borderlands 3 : bad ass | 119.87 | 121.35 | 1.220% |
| Cyberpunk2077(Ultra) | 90.26 | 91.26 | 1.096% |
| Cyberpunk2077(OverDrive+DLSS2 P) | 35.64 | 75.52 | 52.807% |
| Cyberpunk2077(OverDrive+DLSS3) | – | 107.79 | – |
| Guardian of Galaxy (Ultra High+RT)) | 66 | 109 | 39.450% |
| Metro Exodus | 100.26 | 121.71 | 17.624% |
| F1 22 (Ultra High) | 80 | 95 | 15.789% |
| F1 22 (Ultra High+DLSS2 P) | 156 | 169 | 7.692% |
| F1 22 (Ultra High+DLSS3) | – | 225 | – |
| Forza Horizon 5(Max) | 113 | 123 | 8.130% |
| Horizon Zero Dawn | 151 | 164 | 7.927% |
| Rainbow Six Siege | 398 | 496 | 19.758% |
| Shadow of the Tomb Raider (highest) | 156 | 188 | 17.021% |
| Total War: Three Kingdom) | 97.3 | 109.7 | 11.304% |
| Watch Dog Legion(Ultra) | 110 | 111 | 0.901% |
| Watch Dog Legion(RT_Ultra DLSS_P) | – | 117 | – |
与499美元的AMD Radeon RX 7800 XT相比较的话,因为Ray Tracing的差距,可以见到GeForce RTX 4070 Super在DLSS模式开启的游戏环境都有着显著的差距。 至于一般游戏,599 美元的 GeForce RTX 4070 Super 表现似乎也要好上些许。
只是 2 款显示卡有 100 美元的价差… 若想要在Ray Tracing游戏有着更佳的体验,价格较高的GeForce RTX 4070 Super应该是比较好的选择,更不要说GeForce RTX 40系列还支持DLSS技术。
对于预算可能有限制,且对于Ray Tracing游戏需求没有很高的话,499美元的AMD Radeon RX 7800 XT也值得列入考虑范围中; AMD Radeon RX 7800 XT的TBP(Total Board Power)为263W。
Creative – Radeon RX 7800 XT vs Dual GeForce RTX 4070 Super
| Blender | Radeon RX 7800 XT | Dual GeForce RTX 4070 Super | |
|---|---|---|---|
| Monster | 1162 | 3327 | 65.074% |
| Junk Store | 597 | 1562 | 61.780% |
| fishy_cat | 16° | 1671 | 66.248% |
| PugetBench – Premiere Pro | |||
| overall | 11408 | 14344 | 20.468% |
| LongGOP Score | 146 | 146 | 0.000% |
| Intraframe Score | 134 | 140 | 4.286% |
| Raw Score | 117 | 253 | 53.755% |
| GPU | 74 | 83 | 10.843% |
| Davinci Resolve | |||
| 50% retime | 37 | 20 | -85.000% |
| Wedding Heavy Styles | 54 | 38 | -42.105% |
| SuperScale 2x | 25 | 12 | -108.333% |
| SuperScale 4xHD | 134 | 66 | -103.030% |
| Speed Warp | 26 | 12 | -116.667% |
| magic mask | 66 | 18.65 | -253.887% |
| Stable diffusion | |||
| SD 1.5 (50 steps) | 8.95 | 35 | 74.429% |
| 512×512 images/minute | |||
| SDXL (20 steps) | – | 24.5 | – |
| 768×768 images/minute | – | 11.5 | – |
Davinci Resolve 部分的测试数据需要特别留意,因为这里是是数字越小,表现越佳。
相较于 GeForce RTX 4070 Super Founders Edition,ASUS Dual GeForce RTX 4070 Super 在散热部分有着更佳的表现。
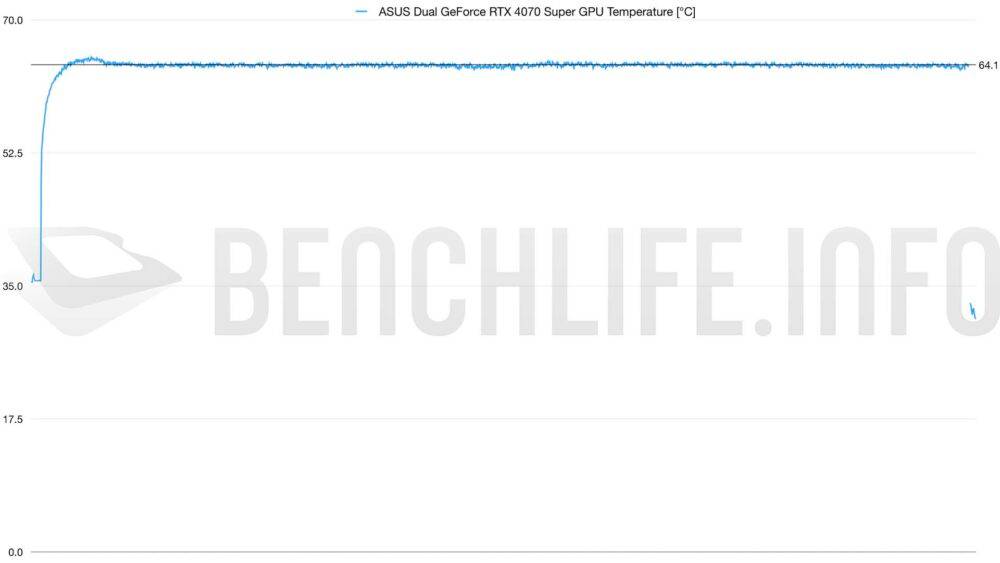
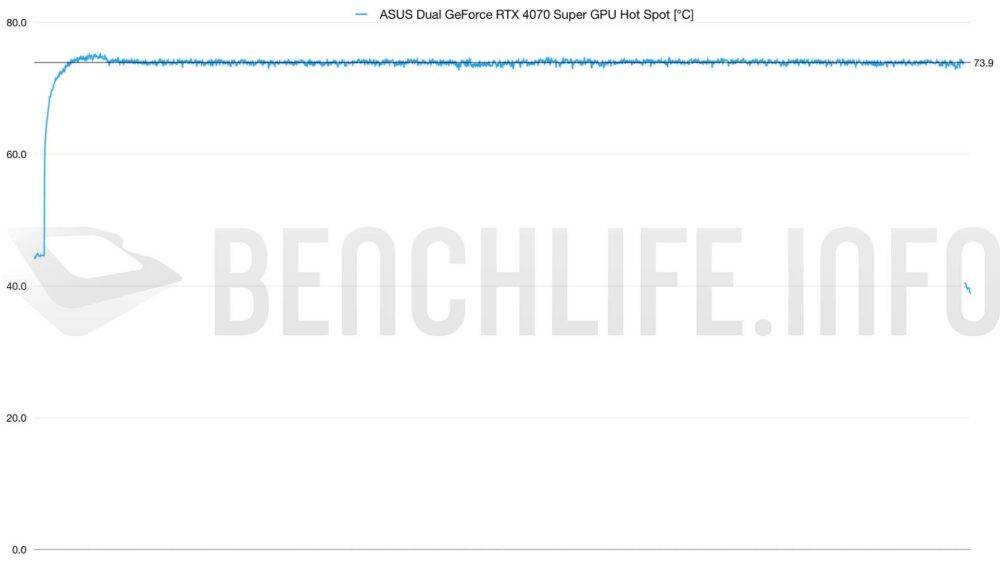

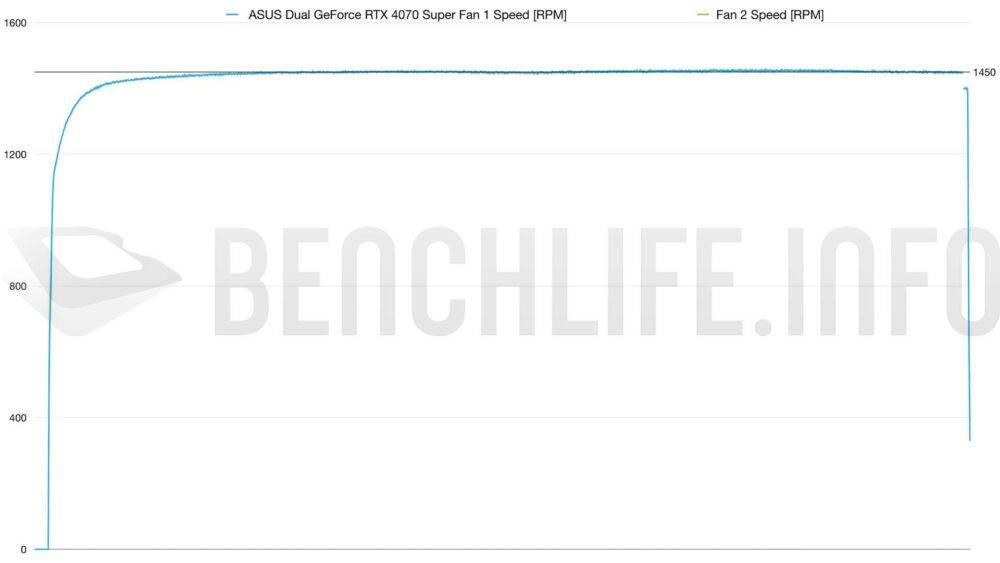
也可以见到 Dual GeForce RTX 4070 Super 的风扇转速在 Furmark 压榨下,其数据落在 1,450 RPM 左右。

虽然我们手上的 Dual GeForce RTX 4070 Super 不是超频版本,但以这张卡的表现(不论是效能或者是温度)都是一张非常值得购入的显卡; 如果选购目标是 GeForce RTX 4070 Super 这款显卡的话。
但,就如我们在 NVIDIA GeForce RTX 4070 Super Founders Edition 测试结论中提到的,如果,你现在使用的是 GeForce RTX 40 系列显示卡,那没有必要更换至 GeForce RTX 4070 Super; 然而,现在使用的是GeForce GTX 10、GeForce RTX 20或者是GeForce RTX 3070以下的显卡,想要更换至GeForce RTX 40系列,那么GeForce RTX 4070 Super在1440p游戏的条件下,是一张非常不错的GeForce RTX 40系列显示卡。
最后,我们会给予ASUS Dual GeForce RTX 4070 Super这款显卡Bronze推荐的肯定。