
「GRE」全名是Golden Rabbit Edition,这包含Radeon RX 6750 GRE以及今天的主角Radeon RX 7900 GRE。
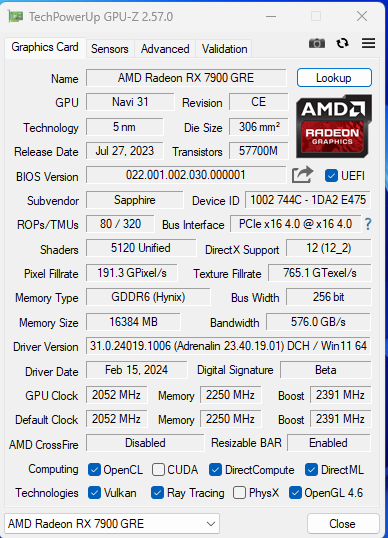
Radeon RX 7900 GRE采用Navi 31 XL GPU芯片,拥有80 Compute Units、80 Ray Accelerators、160 AI Accelerators、5120 Stream Processors,并搭配16GBGDDR6内存。 拥有 64MB AMD Infinity Cache(2nd Gen),可以提供高达 2256.6GB/s 的 Effective Memory Bandwidth。
与其大哥Navi 31 XT和Navi 31 XTX相同,Navi 31 XL采用的是MCM的架构设计,也就是在GCD+MCD; GCD 部分为 5nm,而 MCD 则是 6nm 制程。
与过去Radeon RX 7900 XTX和Radeon RX 7900 XT不同,AMD这次没有提供MBA(Made By AMD)版本的Radeon RX 7900 GRE,而是提供了Sapphire AMD Radeon RX 7900 GRE系列中的Nitro+版本让我们进行测试。

除 Nitro+ 版本外,Sapphire 也有为 Radeon RX 7900 GRE 推出 Pulse+ 版本。
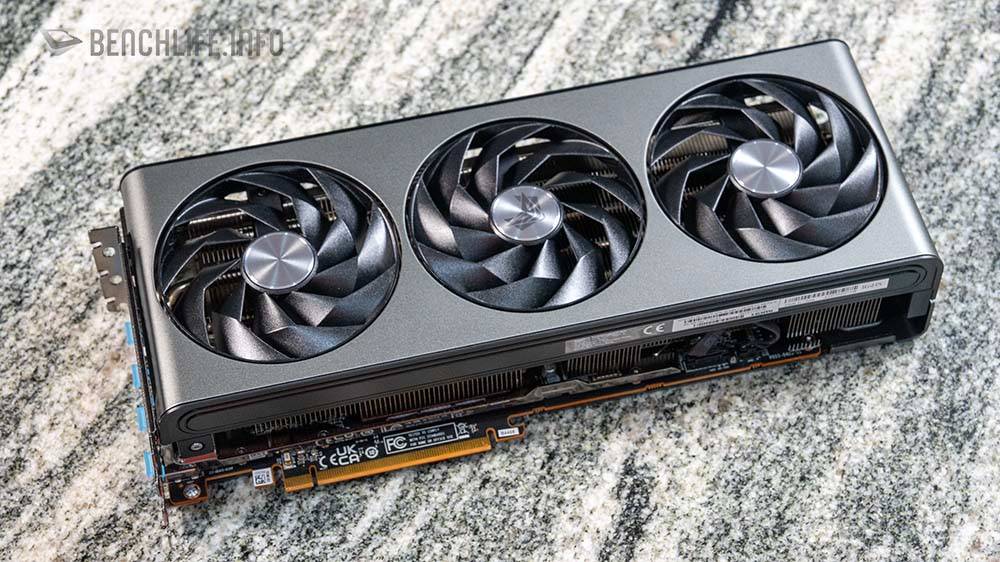
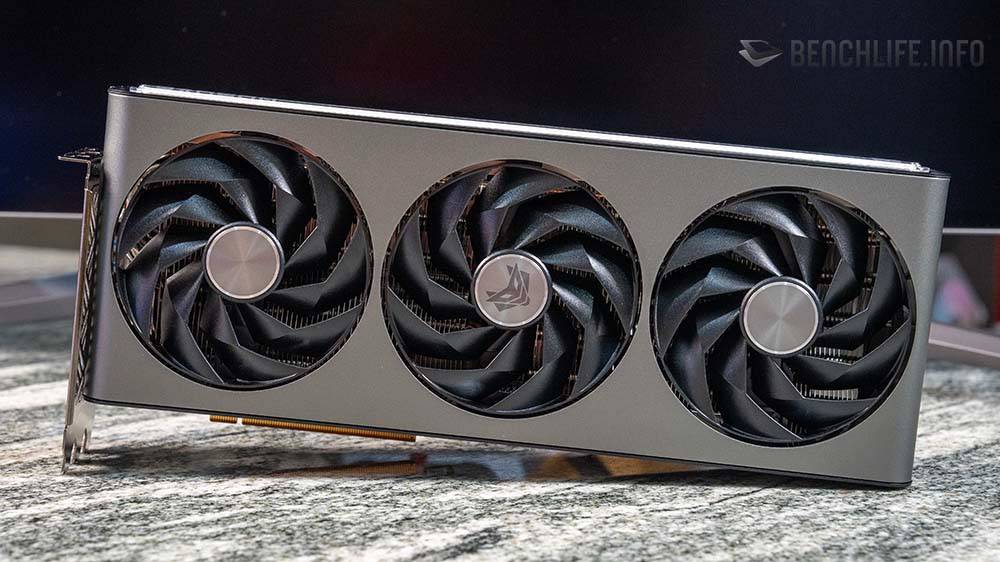
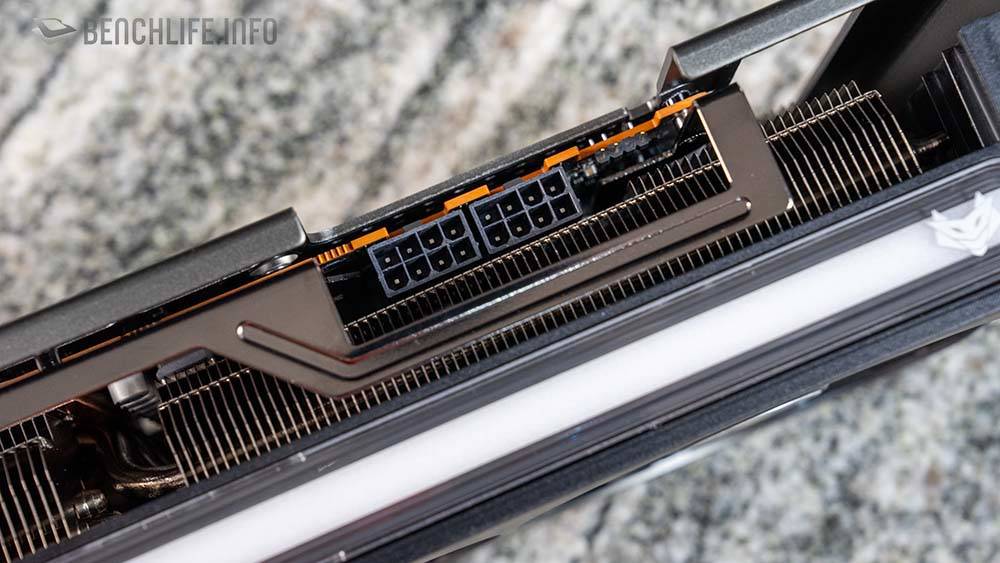
ID 设计上与我们早前测试的 Sapphire AMD Radeon RX 7900 XTX Nitro+ 没有太大不同,依旧维持了 3 风扇设计,但供电部分则是从 3x PCIe 8 PIN 调整至 2x PCIe 8 PIN 供电设计,这主要原因当然是因为 Radeon RX 7900 GRE 的 TBP(Total Board Power)从原先 Radeon RX 7900 XTX 的 420W下调至260W,因此Radeon RX 7900GRE建议使用700W的电源供应器。
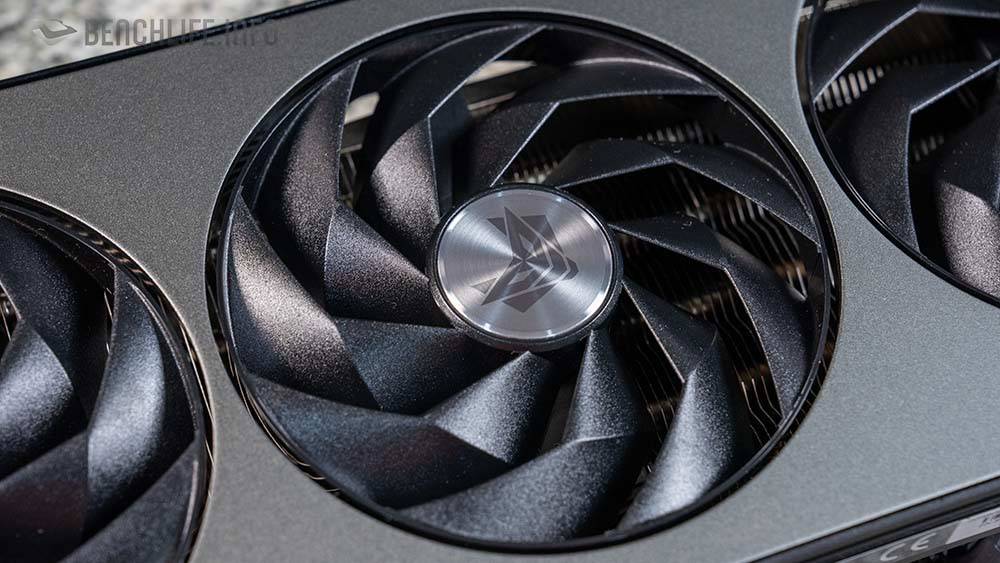
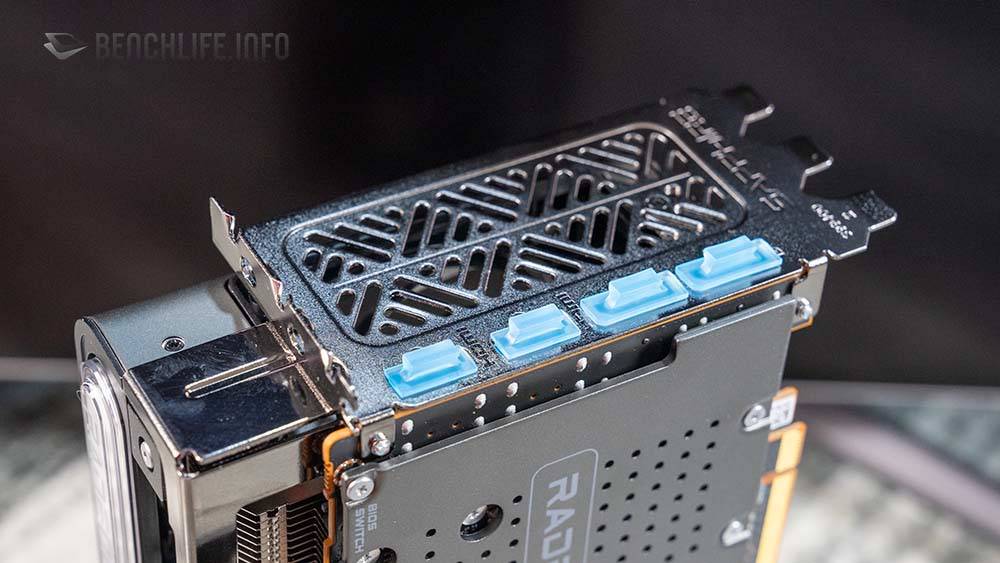
9 叶轴向式风扇部分为双滚珠轴承,尺寸为 95 x 16mm,转速最高可以达到 3200 RPM、49.68 CFM 与 3.19 mmAq,而最大值的情况下,风扇噪音值会达到 49dBA。 这款风扇支持快拆功能,用户只要卸下一颗螺丝就能轻松将叶片拆下进行清洁。
也因为TBP下降,Sapphire AMD Radeon RX 7900 GRE Nitro+也将铝材压铸件设计的框架做了更换(材料– 冷轧钢),同时Radeon RX 7900 XTX使用的VaporChamber也移除,更换为5根热导管+铜底设计的散热模块。 这里面除了TBP的考量外,当然也有成本上的现实面。
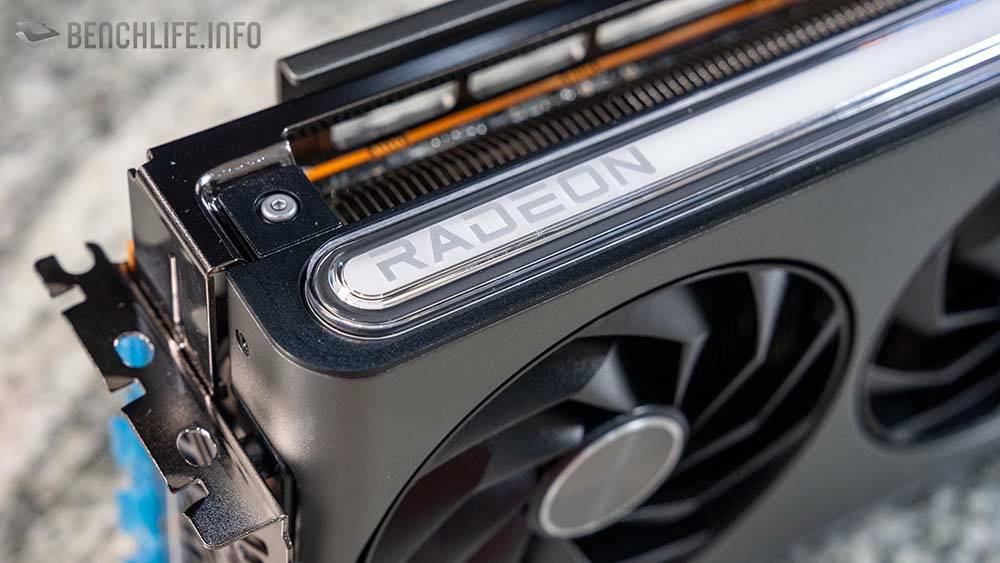
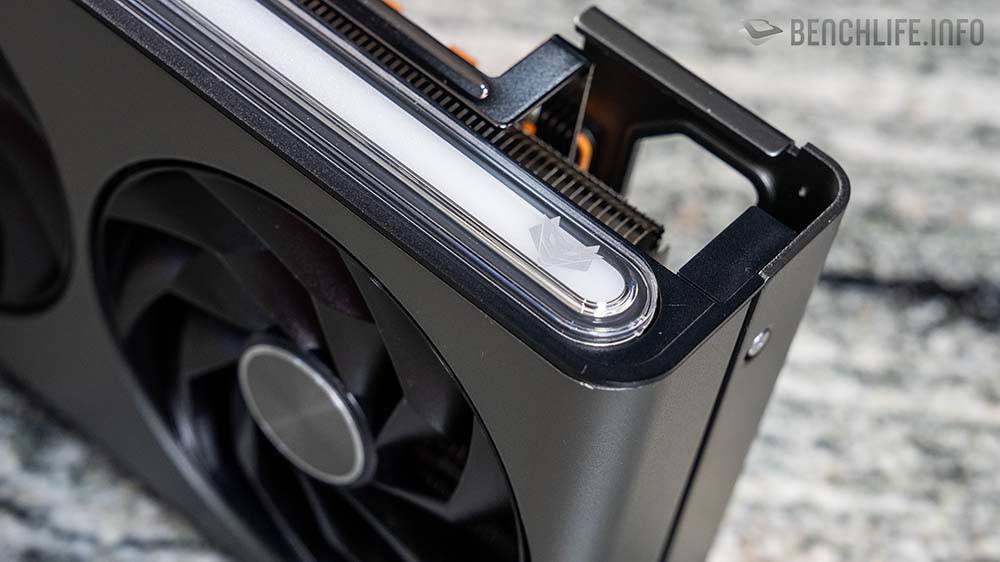
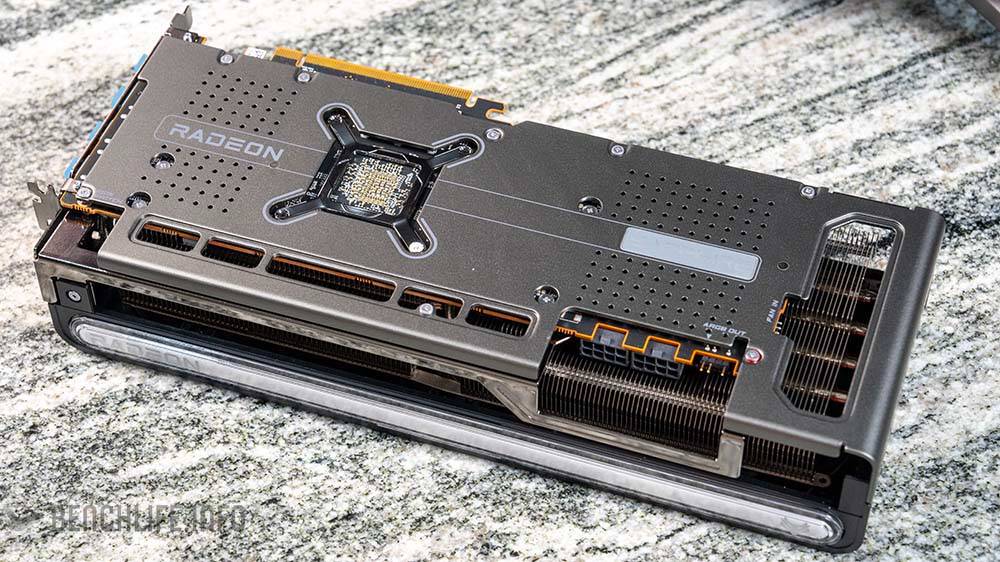
另一方面,Radeon RX 7900 XTX Nitro+ 上下两侧的ARGB灯光效果,到Radeon RX 7900 GRE Nitro+ 仅剩下一侧; 全金属材质的强化背板,可以见到ARGB灯光效果保留了下来。
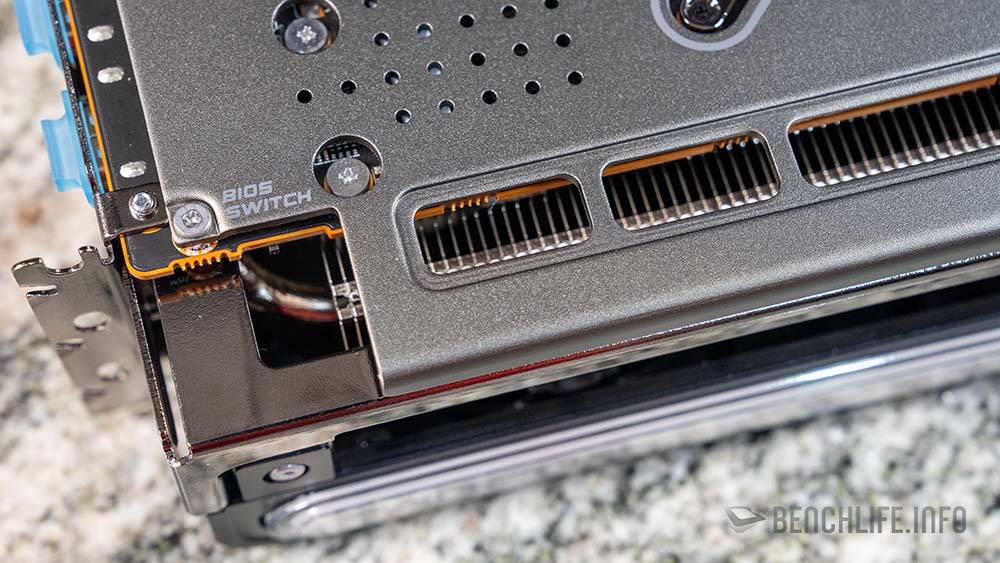
Sapphire AMD Radeon RX 7900 GRE Nitro+ 拥有双 vBIOS、ARGB OUT 以及 FAN IN 设计。
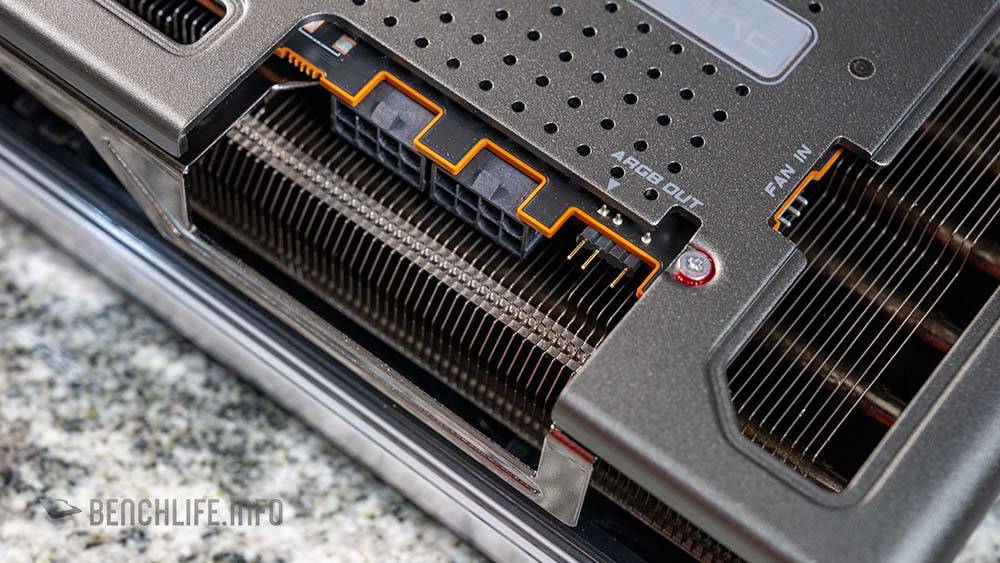
用户可以通过ARGB OUT与主板进行串接,将Sapphire AMD Radeon RX 7900 GRE Nitro+的灯光效果与主板同步; 至于FAN IN设计则是让接上的风扇与显卡风扇同步连动。
接头部分维持了 2x HDMI 2.1a + 2x DisplayPort 2.1 设计。
以建议售价549美元的Radeon RX 7900 GRE来说,其对手非常明显就是GeForce RTX 4070,但测试部分我们选择2024年1月份推出、建议售价599美元的GeForce RTX 4070 Super进行数据上的比较; NVIDIA GeForce RTX 4070 Super 与 GeForce RTX 4070 配置 12GB GDDR6 内存。
3DMark – NVIDIA GeForce RTX 4070 Super Founders Edition
| 3DMark | GeForce RTX 4070 Super | Radeon RX 7900 GRE | |
|---|---|---|---|
| Time Spy | 21428 | 22273 | 3.794% |
| Graphic score | 21073 | 22189 | 5.030% |
| CPU score | 23690 | 22765 | -4.063% |
| Time Spy Extreme | 10513 | 10869 | 3.275% |
| Graphic score | 111Q4 | 10527 | 4.018% |
| CPU score | 13645 | 13329 | -2.371% |
| Fire Strike | 40852 | 41631 | 1.871% |
| Graphic score | 49436 | 52600 | 6.015% |
| Physics score | 56348 | 56178 | -0.303% |
| Combo score | 15048 | 14104 | -6.693% |
| Fire Strike Extreme | 24778 | 26955 | 8.076% |
| Graphic score | 24914 | 27841 | 10.513% |
| Physics score | 56388 | 56180 | -0.370% |
| Combo score | 13169 | 13353 | 1.378% |
| Fire Strike Ultra | 12697 | 14749 | 13.913% |
| Graphic score | 12183 | 14384 | 15.302% |
| Physics score | 56629 | 56259 | -0.658% |
| Combo score | 6874 | 7697 | 10.692% |
| Speed Way | 5259 | 4392 | -19.740% |
| Port Royal | 13117 | 12197 | -7.543% |
| DXR feature test | 62.55 | 44.26 | -41.324% |
不过,在 3DMark 部分,我们则是整理了与 GeForce RTX 4070 和 Radeon RX 7800 XT 的数据供参考。
3DMark – NVIDIA GeForce RTX 4070 Founders Edition
| 3DMark | GeForce RTX 4070 | Radeon RX 7900 GRE | |
|---|---|---|---|
| Time Spy | 18510 | 22273 | 16.895% |
| Graphic score | 17858 | 22189 | 19.519% |
| CPU score | 23343 | 22765 | -2.539% |
| Time Spy Extreme | 8908 | 10869 | 18.042% |
| Graphic score | 8560 | 10527 | 18.685% |
| CPU score | 13601 | 13329 | -2.041% |
| Fire Strike | 36576 | 41631 | 12.142% |
| Graphic score | 43815 | 52600 | 16.702% |
| Physics score | 50577 | 56178 | 9.970% |
| Combo score | 13780 | 14104 | 2.297% |
| Fire Strike Extreme | 20941 | 26955 | 22.311% |
| Graphic score | 21144 | 27841 | 24.054% |
| Physics score | 51864 | 56180 | 7.682% |
| Combo score | 10650 | 13353 | 20.243% |
| Fire Strike Ultra | 10293 | 14749 | 30.212% |
| Graphic score | 9941 | 14384 | 30.888% |
| Physics score | 51380 | 56259 | 8.672% |
| Combo score | 5322 | 7697 | 30.856% |
| Speed Way | 4486 | 4392 | -2.140% |
| Port Royal | 11258 | 12197 | 7.699% |
| DXR feature test | 51.55 | 44.26 | -16.471% |
3DMark – Sapphire AMD Radeon RX 7800 XT Pulse
| 3DMark | Radeon RX 7800 XT | Radeon RX 7900 GRE | |
|---|---|---|---|
| Time Spy | 19343 | 22273 | 13.155% |
| Graphic score | 18863 | 22189 | 14.989% |
| CPU score | 22607 | 22765 | 0.694% |
| Time Spy Extreme | 9397 | 10869 | 13.543% |
| Graphic score | 8908 | 10527 | 15.380% |
| CPU score | 13649 | 13329 | -2.401% |
| Fire Strike | 38251 | 41631 | 8.119% |
| Graphic score | 47327 | 52600 | 10.025% |
| Physics score | 56222 | 56178 | -0.078% |
| Combo score | 13110 | 14104 | 7.048% |
| Fire Strike Extreme | 23713 | 26955 | 12.027% |
| Graphic score | 24112 | 27841 | 13.394% |
| Physics score | 55641 | 56180 | 0.959% |
| Combo score | 11949 | 13353 | 10.514% |
| Fire Strike Ultra | 12268 | 14749 | 16.821% |
| Graphic score | 11934 | 14384 | 17.033% |
| Physics score | 56198 | 56259 | 0.108% |
| Combo score | 6251 | 7697 | 18.787% |
| Speed Way | 3803 | 4392 | 13.411% |
| Port Royal | 10183 | 12197 | 16.512% |
| DXR feature test | 33.98 | 44.26 | 23.226% |
4K Gaming – NVIDIA GeForce RTX 4070 Super Founders Edition
| 4K Gaming | GeForce RTX 4070 Super | Radeon RX 7900 GRE | |
|---|---|---|---|
| Assassin Creed Vahalla | 85 | 78 | -8.974% |
| Avata Frontiers of Pandora (Ultra) | 33 | 32 | -3.125% |
| Avata Frontiers of Pandora (FSR 3 Performance) | 118 | 124 | 4.839% |
| Borderlands 3 : bad ass | 63 | 75.51 | 16.567% |
| Cyberpunk2077(Ultra) | 36.61 | 44.44 | 17.619% |
| Cyberpunk2077(OverDrive+DLSS2 P) | 39.88 | 22.68 | -75.838% |
| Cyberpunk2077(OverDrive+DLSS3) | 46.74 | – | – |
| Guardian of Galaxy (Ultra High+RT)) | 52 | 42 | -23.810% |
| Metro Exodus | 73.65 | 76.09 | 3.207% |
| F1 22 (Ultra High) | 44 | 47 | 6.383% |
| F1 22 (Ultra High+DLSS2 P) | 101 | 112 | 9.821% |
| F1 22 (Ultra High+DLSS3) | 117 | – | – |
| Forza Horizon 5(Max) | 82 | 96 | 14.583% |
| Horizon Zero Dawn | 83 | 87 | 4.598% |
| Rainbow Six Siege | 230 | 257 | 10.506% |
| Shadow of the Tomb Raider (highest) | 89 | 88 | -1.136% |
| Total War: Three Kingdom) | 52 | 53.5 | 2.804% |
| Watch Dog Legion(Ultra) | 62 | 71 | 12.676% |
| Watch Dog Legion(RT_Ultra DLSS_P) | 76 | – | – |
1440p Gaming – NVIDIA GeForce RTX 4070 Super Founders Edition
| 1440p Gaming | GeForce RTX 4070 Super | Radeon RX 7900 GRE | |
|---|---|---|---|
| Assassin Creed Vahalla | 128 | 129 | 0.78% |
| Avata Frontiers of Pandora (Ultra) | 65 | 62 | -4.84% |
| Avata Frontiers of Pandora (FSR 3 Performance) | 177 | 211 | 16.11% |
| Borderlands 3 : bad ass | 121.35 | 141.94 | 14.51% |
| Cyberpunk2077(Ultra) | 91.26 | 106.61 | 14.40% |
| Cyberpunk2077(OverDrive+DLSS2 P) | 75.52 | 44.87 | -68.31% |
| Cyberpunk2077(OverDrive+DLSS3) | 107.79 | – | – |
| Guardian of Galaxy (Ultra High+RT)) | 109 | 79 | -37.97% |
| Metro Exodus | 121.71 | 119.76 | -1.63% |
| F1 22 (Ultra High) | 95 | 93 | -2.15% |
| F1 22 (Ultra High+DLSS2 P) | 169 | 171 | 1.17% |
| F1 22 (Ultra High+DLSS3) | 225 | – | – |
| Forza Horizon 5 (Max) | 123 | 138 | 10.87% |
| Horizon Zero Dawn | 164 | 166 | 1.20% |
| Rainbow Six Siege | 496 | 436 | -13.76% |
| Shadow of the Tomb Raider (highest) | 188 | 172 | -9.30% |
| Total War: Three Kingdom) | 109.7 | 112.3 | 2.32% |
| Watch Dog Legion(Ultra) | 111 | 122 | 9.02% |
| Watch Dog Legion(RT_Ultra DLSS_P) | 117 | – | – |
支持DLSS的游戏都能见到英伟达 GeForce RTX 4070 Super 的表现是处于优势,但大部分游戏测试都可以见到 Radeon RX 7900 GRE 有着比较好的表现。
Creator – NVIDIA GeForce RTX 4070 Super Founders Edition
| Creator | GeForce RTX 4070 Super | Radeon RX 7900 GRE | |
|---|---|---|---|
| Blender | |||
| Monster | 364P | 1281 | -161.124% |
| Junk Store | 1563 | 684 | -128.509% |
| fishy_cat | 1653 | 651 | -153.917% |
| PugetBench – Premiere Pro | |||
| overall | 14236 | 11992 | -18.712% |
| LongGOP Score | 144 | 149 | 3.356% |
| Intraframe Score | 138 | 133 | -3.759% |
| Raw Score | 249 | 147 | -69.388% |
| GPU | 83 | 71 | -16.901% |
| Davinci Resolve | |||
| 50% retime | 20 | 31 | 35.484% |
| Wedding Heavy Styles | 38 | 64 | 40.625% |
| SuperScale 2x | 12 | 24 | 50.000% |
| SuperScale 4xHD | 66 | 108 | 38.889% |
| Speed Warp | 12 | 15 | 20.000% |
| magic mask | 18.04 | 48.66 | 62.926% |
| Stable diffusion | |||
| SD 1.5 (50 steps) | |||
| 512×512 images/minute | 36.4 | 13.8 | -163.768% |
| SDXL (20 steps) | |||
| 1024×1024 images/minute | 11.47 | 7.05 | -62.695% |
Creator 部分可以见到 NVIDIA GeForce RTX 4070 Super 的优势; Davinci Resolve 部分,数字越小,表现效能越好…
跟着看看 Sapphire AMD Radeon RX 7900 GRE Nitro+ 这款显卡的温度、风扇转速与功耗(Total Board Power, TBP)表现。
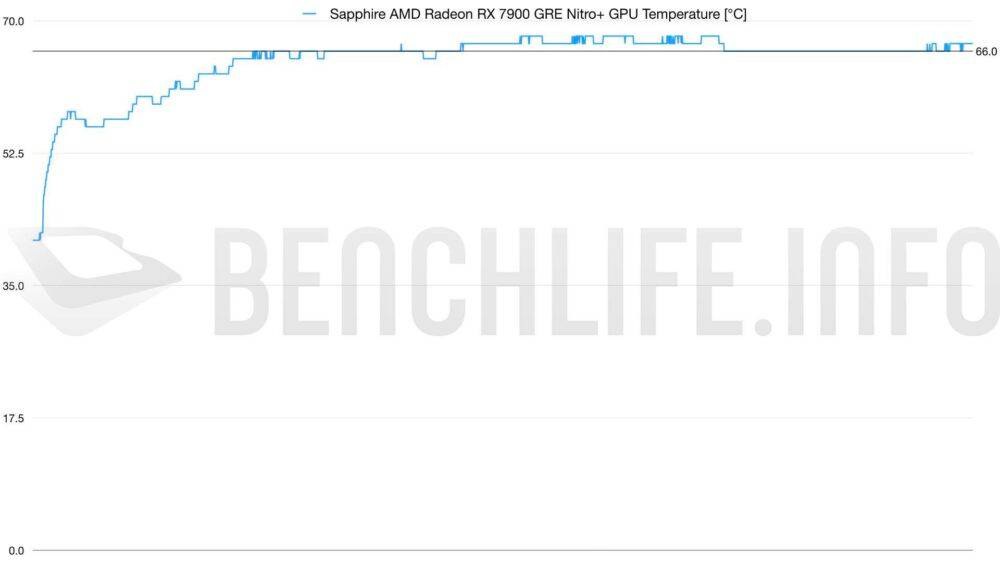
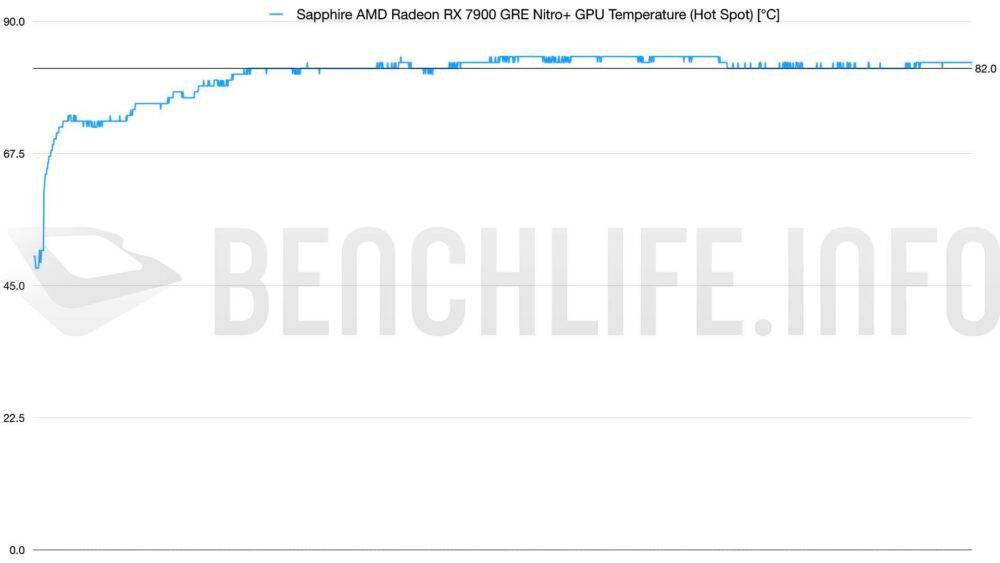
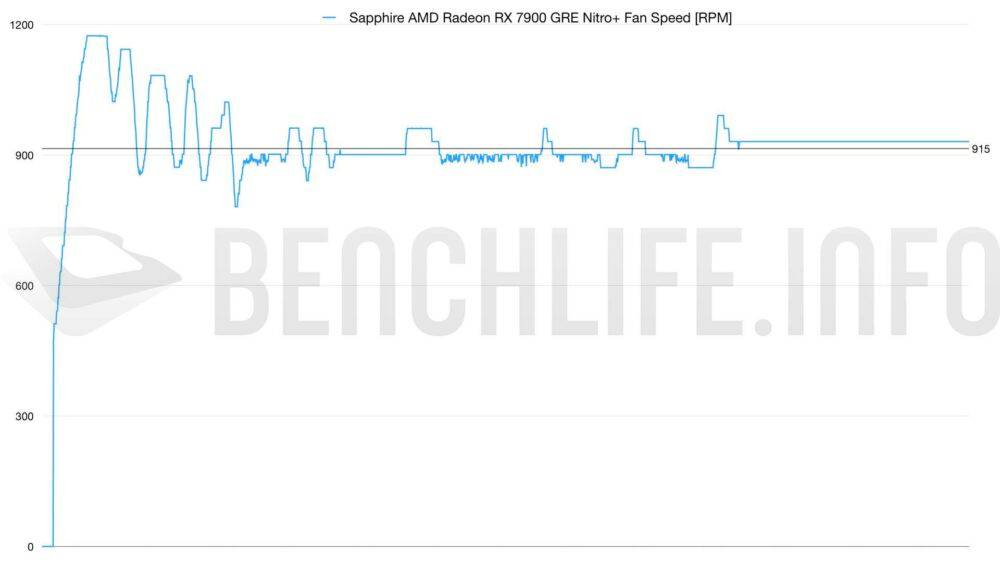
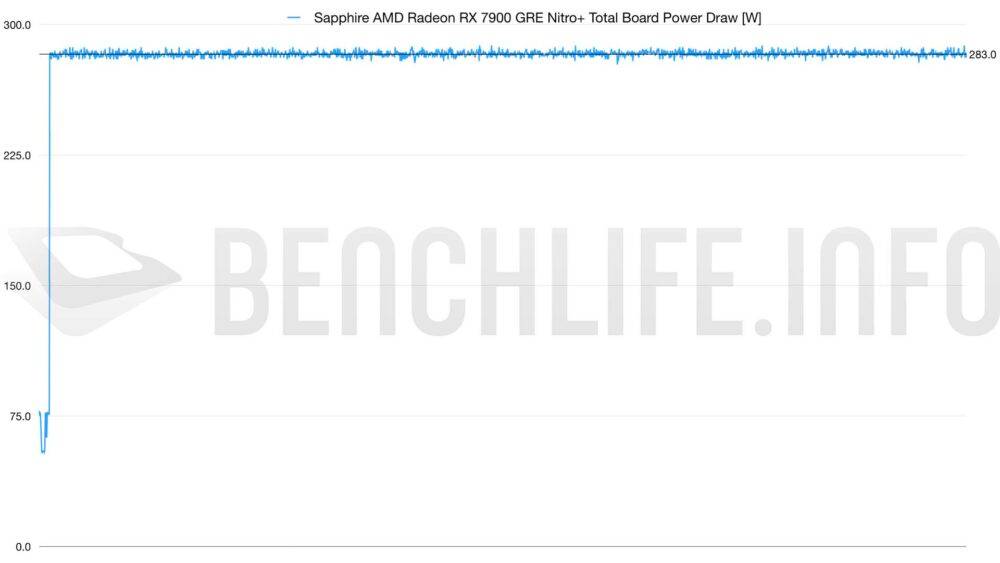
Sapphire AMD Radeon RX 7900 GRE Nitro+
GPU TEMP:66°C(AVG);
GPU Hot Spot:82.0°;
FAN:915 RPM;
TBP:283 WATTS;
虽然AMD Radeon RX 7900GRE给出的TBP为260W,但Sapphire AMD Radeon RX 7900GRE Nitro+在我们的实测中,TBP数字可以达到283W; Sapphire AMD Radeon RX 7900 GRE Nitro+ 默认 TBP 为 275W。
结构上虽然与我们早前测试的 Sapphire AMD Radeon RX 7900 XTX Nitro+ 有些许差异,好比前面提到的 Vapor Chamber、铝材压铸件中框移除,但这些都是因为成本以及功耗方面的考量。
依照 Sapphire 显卡的规划,是以安静为导向,所以风扇转速偏低,但我们以开放平台方式进行测试的过程中,发现到这样的行为会让 GPU Hot Spot 超过 80 度,用户也许可以考虑自行将风扇转速往上调整,这样可以让显示卡获得更好的散热表现。
建议售价 549 美元的 AMD Radeon RX 7900 GRE 若与同价位的 GeForce RTX 4070 比较,原则上游戏表现基本上是没有任何压力。 也可以见到我们与 GeForce RTX 4070 Super 的测试比较中,AMD Radeon RX 7900 GRE 整体也有着非常不错的表现。
至于功耗部分,有人不在意,但也有人会很在乎。
伴随着Radeon RX 7900GRE推向全球市场后,整个RDNA 3GPU架构也告一段落。 MCM架构的RDNA 3确实让我们相当惊艳,也许在Ray Tracing部分,AMD与NVIDIA还是有一段距离要走,但我们也见到AMD相当努力赶上,并也推出不少新的技术来提升Radeon Graphics的体验,就让我们期待AMD在RDNA 4 GPU架构的创新吧。